
I wrote earlier about profiling F# code for memory usage. I’ve been looking at products for profiling speed, and have settled on JetBrains dotTrace for the forthcoming .NET release of our PDF tools. Here are a couple of screenshots profiling speed on our PDF library:
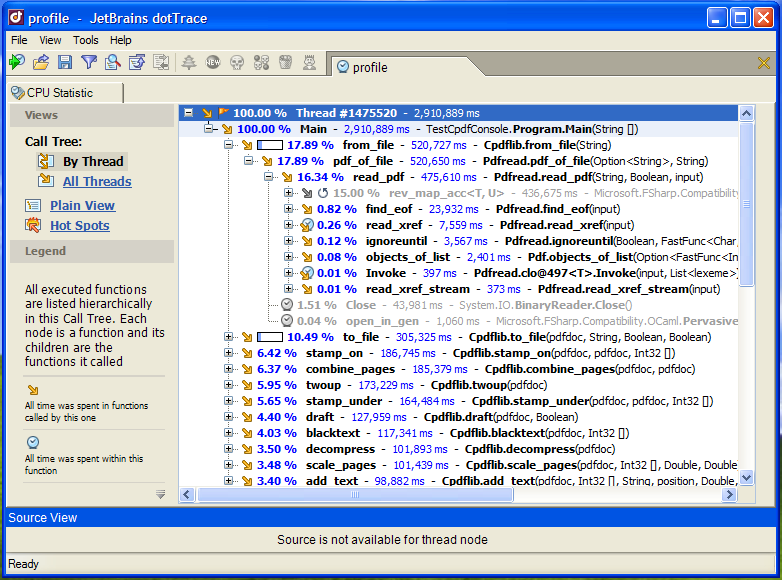
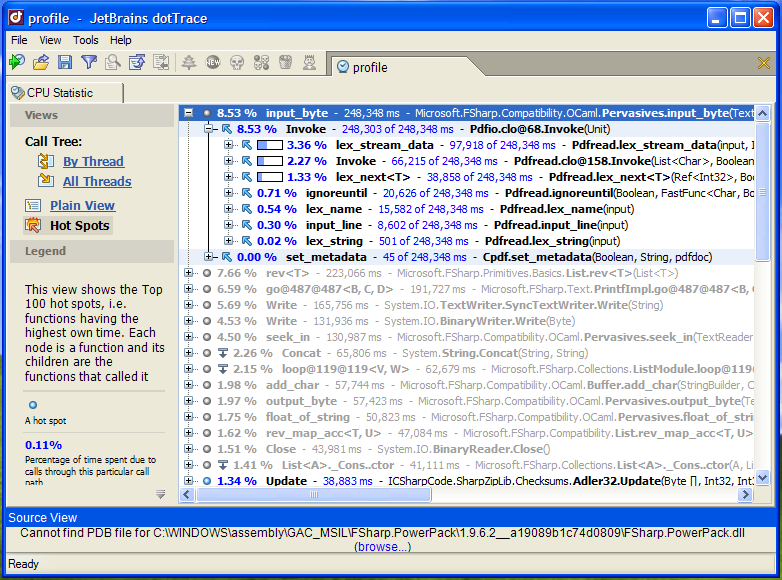
The speed increases achieved are partly F#-specific, but plenty of the changes made have speeded up the code when compiled with OCaml too.